Only released in EOL distros:
Package Summary
Takes an image of a face (and a mask image) and extracts characteristic lines and returns an image of those.
- Author: Fabian Wenzelmann and Julian Schmid
- License: BSD
- Source: svn http://alufr-ros-pkg.googlecode.com/svn/trunk/portrait_bot
Contents
Overview
On the most basic level this package uses the gaussian blur filter and a canny filter from opencv2 to generate a contour image. The hard part is to actually find parameters (for the gaussian blur and canny) that generate good contour images. For different images you will need different parameters. This packages uses two different approaches to find parameters and even let's the user modify the parameters in a gui (if so desired).
The centrals components of the face_contour_detector are:
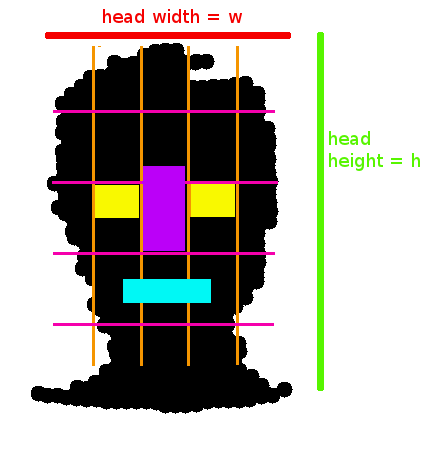
face_areas.py: Provides a service, which takes an image of a mask. The mask marks where the face is in the image. It then tries to find the areas which contain the nose, the eyes and the mouth. The coordinates of these areas will then be replied.
autoselect_service: Provides a service which takes an image of a face and a mask image. First it blurs and deletes the area, not marked mask. It then tries to find good parameters for the gaussian blur and a canny filter, so that a good contour image will result. These parameters will be chosen by trying different parameter combinations and returning the best ones (look at "How does it work" section for more informations). It also asks the auto_selector.py for parameter proposals and finally sends all parameter proposals to the gui_service.py.
auto_selector.py: The user can rate edge images - all these information are stored in a sqlite database. auto_selector.py tries(!) to use the information to find parameters for new images.
gui_service.py: Displays a gui which allows you to choose one of the received proposals and then modify the parameters and areas. It also allows you to rate your result (which will imporve the results provided by auto_selector.py)
filter_services: Provides a service which allows to apply filters to image areas. It also calculate a number of properties (number of graphs, graphmass ...) that describe the result.
Tutorial
There are some tutorials on how to use the face_contour_detector alone and reconfiguring it on the face_contour_detector/Tutorials page. For a tutorial how to start it with the rest of the packages in the portrait_bot stack, have a look at the portrait_bot/Tutorials page.
How does it work?
face area finder (face_areas.py)
The face areas are estimated according to the mask image. Everything that is black in the mask image is supposed to be part of the image. The position of the areas are estimated using fixed pattern for human faces. The general partition is shown in the following picture

exploring parameter selector (autoselect_service)
The exploring parameter selector tries to reach the preconfigured graph mass for each image. This is being done by trying different combinations of parameters. The graph mass describes a contour image and is defined as:
graph mass = (w*((width/100) + (height/100)))/(b)
w = the number of pixels with a line
b = the number of pixels without a line
width = the width of the image
height = the height of the image
The height and width are mainly in this formula to compensate for the changing thickness of the line depending on the image size.
In early tests we found out that the graph mass is pretty much a monotone function. So to find parameters, which result in the target graph mass, we can simply calculate the edges of a parameter area and then can say if the target graph mass is within this parameter area.
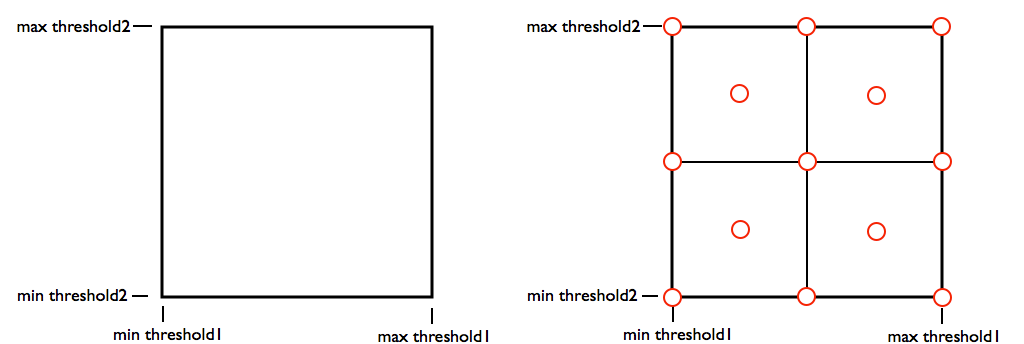
The algorithm behaves as follows (example with the two parameters threshold1 and threshold2):

- The main parameter area will be split up into 2^(num parameters) sub areas.
- All graph mass values for the edges and middle points of the subareas will be calculated (marked as red circles).

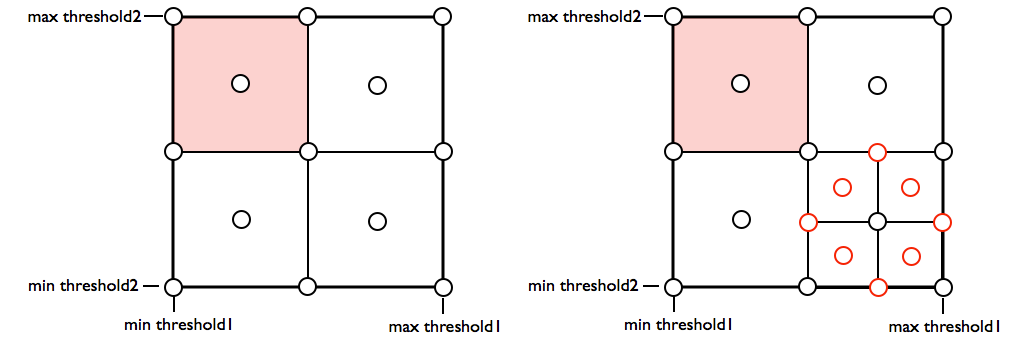
- All the areas which do not contain the target graph mass will be discarded (marked red).
- The area that contain the parameter point which is closest to the target graph mass will be split up and the needed edges and middle point will be calculated (red circles).
- This will be repeated for limited number of steps and at the end the points (combination of parameters) with the closest graph mass to the target value will be displayed as proposals.
The current version uses these 3 parameters: threshold1 (canny filter), threshold2 (canny filter) and blur width (gaussian blur). All the other parameters will be set statically. If you want to change the target graph mass for an area read this Tutorial.
experience based parameter selector (auto_selector.py)
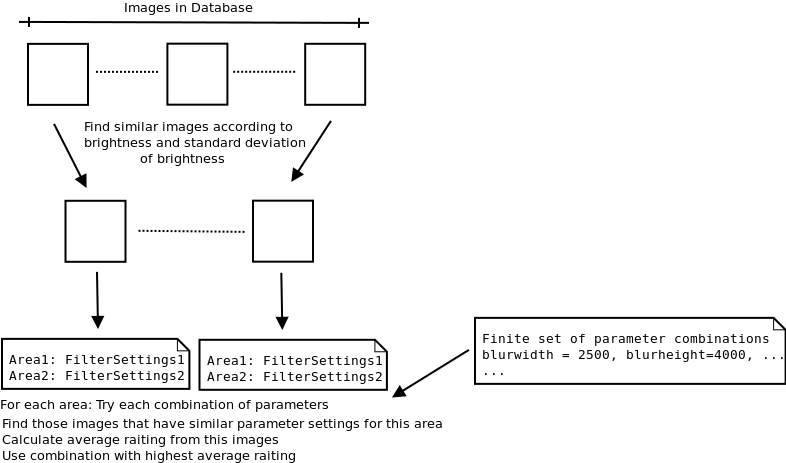
To improve edge detection, we store statistics about images in a database with the settings used for each image area. The user can rate images by assigning the edge image a value between 1 and 6 (where 6 is the best and 1 is the worst rating). When the user clicks the "Rate" button, we extract information about the image and store it in the database together with all parameter settings (for each area) and the rating. To find good parameters for each image area of a new image we scan the database and find images "similar" to the new image by comparing the respective statistics. This results in a set of images, similar to the new image (its nearest neighbours). Now we look at each area of the new image, applying a set of fixed parameter combinations (1600 combinations by default). For each area and each parameter combination we search through the nearest neighbours for similar thresholds in the respective area. The ratings of the images in which similar parameters for an area were found are averaged to estimate the quality of the area's parameter set.
The idea is as follows: First we find images that are comparable to the new image by using the stored image statistics. Then we need the filter settings for each area. So we check each combination from our combination set to find the combination with the best expected rating. To get an expected rating we search for the images that have similar filter settings in our image set. So we have: An image that is similar to the new image and a reference area with filter settings like or proposal. Each of these images has a rating and we calculate just the average. Finally we choose the combination which maximizes the expected rating. The following image visualizes this process: 
